Goals and Background
The goal of this lab is to use API for JavaScript to customize one web app and to create two web apps to embed in a webpage. The use of ArcGIS JavaScript API allows for the creation of widgets, themes, and analytics from scratch, and allow for the customization of existing web apps. The use of ArcGIS JavaScript in this lab will be used to modify window extents, create scalebars, import data, import basemaps, and to create a routing solver application. This lab is broken into three parts.
Figure 5.1 displays the JavaScript for the basemap web app . In this script the require command is used to import the necessary modules from the Dojo library, and a function is used to set the extent, type, and zoom of the map.
Figures 5.3 and 5.4 show the JavaScript used to construct the tree map. In the code, several modules are imported from the Dojo library, multiple variables are defined to create or import features on the map such as pop-up windows, feature layers, and map extent, and two functions are used: one is to make the imported Dojo modules accessible, and the other is to display only the address and common name information for the trees in the pop-up window.
Methods
Part 1: Create a Basic Web GIS Mapping App
This part consists of creating and displaying a basemap in a webpage without any data on it through referencing the dojo library. The styling for the map was imported through the use of claro through arcgis.com, but the styling for the web extent is set.
Step1: Write the HTML Code:
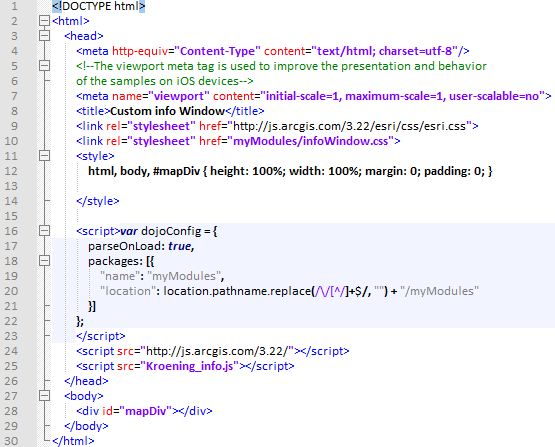
Figure 5.0 shown below details the HTML portion of the code. The html code is what is used to display the final web app in a web page. In this document, the formatting of the webpage is coded, and the css file for the styling of the map and JavaScript file where the map is set up is referenced. There are a few lines of css in the HTML in here to display the extent of the imported map. These are inserted directly into the HTML because there is so few lines of it.
Step 2: Write the JavaScript File to Import and Format the Web GIS BasemapFigure 5.1 displays the JavaScript for the basemap web app . In this script the require command is used to import the necessary modules from the Dojo library, and a function is used to set the extent, type, and zoom of the map.
 |
| Fig 5.1: JavaScript for Basemap |
Part 2: Build a Web GIS App with Operational Layer Functionality
Section 1: Developing JavaScript Methods to Display Tree Species and Attributes
In this section, a web GIS app was created to display the location of trees in the San Francisco area. A pop up will be configured so that when a tree is clicked on, it displays the address of the tree and the common name of it.
Step 1: Write the HTML Code
Figure 5.2 shown below displays the HTML code used to accomplish the objective above. This code is what formats the map within the web page. The code calls in the JavaScript file and the css file where the map is configured and styled. The css for this web app map is stored In the first <script> tag, the script is prompted to run after the parser has already loaded. This helps the map in the webpage to not lag. Also in the HTML is the use of the view import <meta> tag which helps to make the webpage mobile friendly.
 |
| Figure 5.2: HTML for Tree Map |
Step 2: Write the JavaScript for the Tree Map
Figures 5.3 and 5.4 show the JavaScript used to construct the tree map. In the code, several modules are imported from the Dojo library, multiple variables are defined to create or import features on the map such as pop-up windows, feature layers, and map extent, and two functions are used: one is to make the imported Dojo modules accessible, and the other is to display only the address and common name information for the trees in the pop-up window.
 |
| Fig 5.3: JavaScript Code for Tree Map |
 |
| Fig 5.4: JavaScript Code for Tree Map |
Section 2: Feature Service Creation & Development of a Web App for Eau Claire Schools
In this section, the previous code used in figures 5.2, 5.3, and 5.4 are copied and then modified to produce a map which shows schools in Eau Claire with their addres, name, and elevation in the pop-up window. Instead of referencing the feature class from ArcGIS Online, the feature class will be referenced from the department server. Before this though, the data must be published and formatted first. Also, a scalebar will be added to the map, and the extent will be modified. Step 1: Publish the School Data to The Server First, the data had to be prepared to be published to the department server. The address data for the schools was provided in an Excel sheet, and the school location data was provided in a shapefile. The Excel sheet had to be joined to the school shapefile using ObjectID as the common key. Then, this joined table with the shapefile was exported as a new feature class into a geodatabase. Next, the feature class was published to the server the using the same process described in part 2 of lab 2. Step 2: Modify the Existing Code to Display the School Address Map The HTML for this web app is shown below in figure 5.5. Only one line of code had to be changed in the HTML. This was the line in which the JavaScript script is referenced.
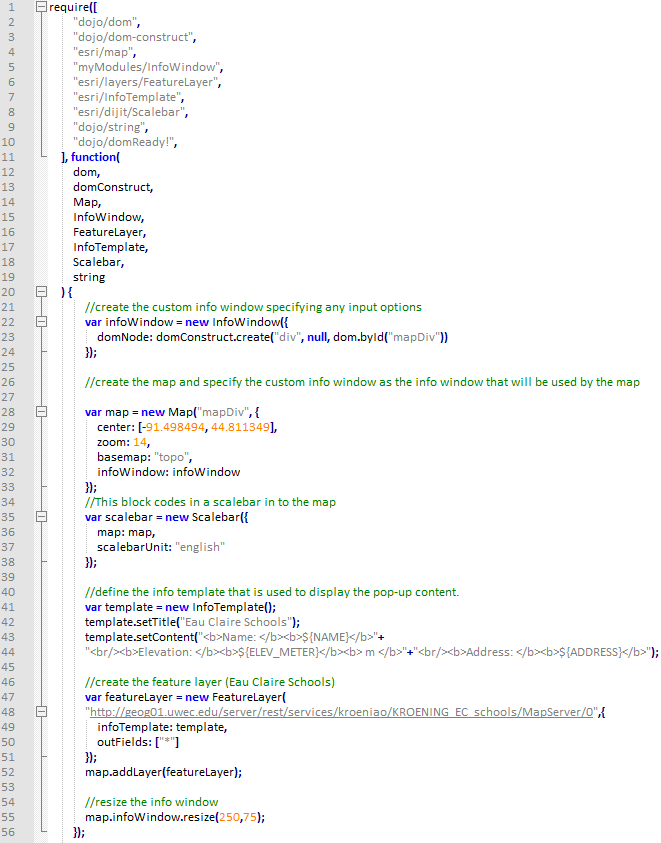
Figure 5.6 shows the JavaScript used for the school map. A scale bar will be added to the map, the pop up window will be modified, and the lodaded extent will be chaged. These changes can bee seen below. In the script, the esri/dijit/Scalebar module was added and then used to create a scalebar in lines 35-38, the map zoom and loaded extent was changed in lines 29 and 30, and the pop-up was reconfigured in lines 42-44, and 55. Also, because the map no longer needs to work with graphics from a hyperlink, the getTextContent (graphic) function was deleted.
Part 3: Developing a Simple Routing Application
Step 1: Code the HTML
Figure 5.7 dislays the HTML used to code the routing application. This is where the css and JavaScript files are referenced and where the <div> for the map is created. Also, a few webpage elements such as background color and introductory text were added to make the webpage look more appealing.
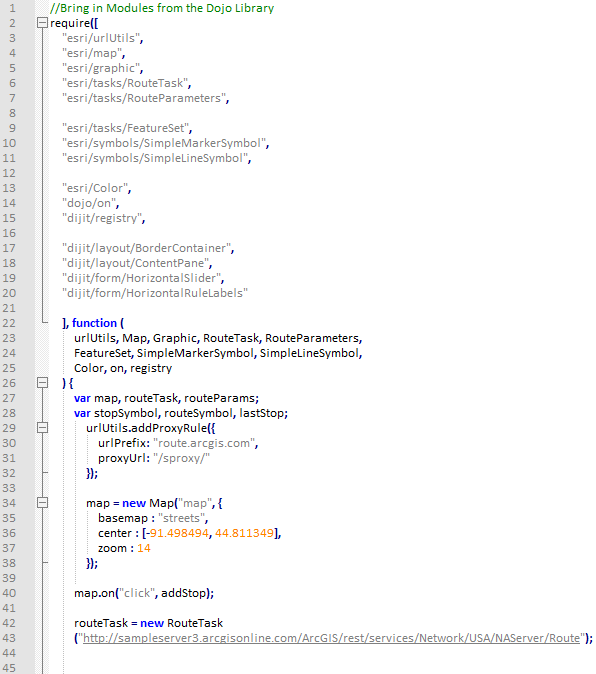
Below, in figures 5.8 and 5.9 is the JavaScript coded for the routing application. As usual, the necessary modules are importedd from the Dojo library and are then made usable in the function definition parameter. Then, a series of variables and functions are used to develop the routing web app.
Results
The results of parts 1, 2, and 3 are four different web applictions saved on the university's server. Because of this, these applications can only be viewed if one has access to all of the files which can be done through connecting to the Univerity of Wisconsin Eau Claire's internet. Because all off the code for these web applications are hosted on the university's server, screenshots of the applications are provided. Also, links to the applications are provided for readers using the university's internet.
Figure 5.10 shows the web application created in part 1. The link to this application is found here: Basic Basemap Application. This application allows the end user to view the streets basemap. The user can zoom in and out at different scales and can pan around on the map.
The San Fransisco tree mapping application is the results of the code displayed in the methods in part 2, section 1 and is shown below in figure 5.11. It is also linked here: San Francisco Trees Map. In this application users can zoom in and out and pan around like before and they can see the locations of trees in the San Francisco area. They can even click on a tree to view the address of it and its common name. Figure 5.12 is what the pop-up window looks like.
ArcGIS for Developers. (2017). Retrived November 07, 2017, from https://developers.arcgis.com/ Dojo Toolkit Reference Guild. (n.d.). Retrieved November 07, 2017, from http://dojotoolkit.org/reference-guide Geog 455 (2013, November). [EC School Addresses]. Unpublished raw data. Mueser, M (2012, October 1). U.S. Geographic Names Information System (GNIS) Shapefiles Based on USGS GNIS Data. Retrieved November 07, 2017, from http://www.mapcruzin.com/geographic-names-shapefiles/#School Wilson, C. (2017). Lab 5 ArcGIS API for JavaScript 1 https://drive.google.com/file/d/173Et59MebzhjihBHwQFfg6AVuFjlSpHe/view?usp=sharing |


No comments:
Post a Comment