Sunday, February 4, 2018

Creating a Query Application with ArcGIS JavaScript API, Css, and Html for MN Deer Harvest Statistics

Introduction
  The goal of this project is to code a query application using ArcGIS JavaScript API, Css, and html to display deer harvest statistics from the state of MN. This project incorporates objectives learned throughout the course as well as other things learned independently by the author. A very detailed report 23 pages in length has been created for this project which can be seen by clicking on Report on MN Deer Harvest Statistics

Application
 The actual application is in the form of a Webpage and can be seen by clicking on MN Deer Harvest Statistics Application. Note that the server for which this link is hosted on no longer exists. Below is a screen capture of what the map portion of the application looks like. When the server was alive, users could change the attributes displayed in the map by hovering over the year buttons on the left and then by checking the desired radio button correlating to one of the five attributes. This is detailed more in the report.
Fig 9.0: MN Deer Harvest Application

Tuesday, December 5, 2017

Lab 8: Geoprocessing Services and Web Tools

Goals and Background

  Geoprocessing services are a relatively new frontier in the field of Web GIS. Geoprocessing services use many different spatial tools and inputs to solve GIS issues. For example, this lab demonstrates how to create geoprocessing serves over the web. This geoprocessing service will be created to determine the best potential locations to put a factory in Wisconsin. This is determined by filtering features. The factory location must be within a defined distance from rivers (minimum distance is 5 km), railroads (minimum distance is 5 km), location and a distance from that location (minimum is 50 km), and a defined population threshold for nearby cities (minimum is 4,000).


Methods

  First, a new model was created with the work-space and scratch space environments set to a select file geodatabase. This model was created in a new Toolbox. The model created can be seen below in figure 5.0.
Fig 5.0: Model For Factory Sites
  There are four main input feature classes. These are the rivers, railroads, Wisconsin cities, and the input location of interest. The model starts with inputting a location of interest. This area of interest is a point which is specified when the model is ran. Then, a buffer from this point is created. This creates the Point_Buffer. Next, This Point_Buffer is clipped independently to the railroads feature class, rivers feature class and the selected cities feature class. The select tool on the cities to select cities which have a population of at least 4000. Next, a buffer is created from the railroads clip. Here, the input distance from these railroads is defined by the user. The minimum distance is 5 km. Similarly a buffer is created for the rivers also specified by the user. The minimum value is 5 km. Next, the city population threshold is specified by the end user, However, the minimum population is 4000. After that, the railroads buffer is intersected with the river buffer. Then, a spatial join is used to join the selected cities clip to the river and railroad buffer. The intersect tool is used here because using an intersect would result in the the output being a point geometry. The desired output is of the polygon geometry type. Also, the union tool wouldn't work because a union requires two polygon features; here, there is one polygon feature class and one point feature class. Lastly, the dissolve tool was used to eliminate internal boundaries within polygons. After the model was complete, it was ran, and the model was exported as a python script.
  Next, this geoprocessing service was published to the development server. This was done by opening up the results window and then navigating to Share As → Geoprocessing Service. This was then published as an Asynchoronous service because the model will take several minutes to run. Once published, the service was published as a web map and then developed into a Web App using the Web AppBuilder Developer Edition. This was done using a similar process executed in lab 3. In the Web AppBuilder, the feature class symbology was changed so end users can easily understand the features. The geoprocessing widget was used to configure the labels for the model parameters. This is where the labels were made to be more user friendly. For example, "Input_DistanceToRailroads" was "Enter distance to railroads". The last step was to save the widget and test the model in the Web AppBuilder. This was done by clicking on the geoprocessing widget, placing an area of interest point on the map, entering the distance of interest, distance to railroads, and distance to rivers.


Results

 The result of methods section is a Web application which can be accessed here: Determining Potential Factory Locations in Wisconsin. Note, this link can only be accessed if one is connected to the University of Wisconsin Eau Claire's internet. Figure 5.1 is a short video which shows how the web app works. In the video, the inputs all left to all their defaults: 5 km from rivers, 5 km from railroads, 4000 population threshold, and 50 km area distance of interest. The location of interest is placed in Prescott Wisconsin. Then, the model is ran. After the model runs, it shows the locations for the best potential factory locations in the the green polygon areas. Each time the model is ran, the best potential areas will change because of difference in the potential values in the input parameters. This web app could be used 
Fig 5.1: Video of How of to Factory WebApp
  Figure 5.2 is a screenshot of what the interface looks like in the geoprocessing widget. This is where the end user can enter in the desired distance to rivers and railroads, population threshold, location of interest, and distance of interest. The default values can be changed to larger values by the end user.

Fig 5.2: Geoprocessing Widget Interface

  Also as part of the results is the python script generated when exporting the model to python. This script can be viewed here: Factory Model Python Script. If this script were to be ran in PyScripter, it would produce the same result as running the model in ArcMap. a screenshot of the first part of the python script is shown below in figure 5.3. Note that this python script could be used, but was not used in the creation of the geoprocessing service hence the script is a result and not a method.
Fig 5.2: Exported Python Script
Fig 5.3: Exported Python Script

Sources

nhd.usgs.gov  2017, (n.d) Rivers Feature Class retrived from https://nhd.usgs.gov/
U.S. National Atlas, 2017. Wisconsin_Cities Feature Class
U.S. National Transportation Atlas, 2017. Railroads Feature Class
Wilson, C (2017) Lab 8 Geoprocessing Services Web App retrieved from

Sunday, November 26, 2017

Lab 7: Creating a Volunteer Geographic Information (VGI) Application

Goals and Background

  This lab uses JavaScript API for ArcGIS to create a VGI mobile responsive app. VGI apps can be used for many different things such as locating fires or where paramedics need to attend in the wake of a natural disaster. In general, VGI apps are used when a large amount of data needs to be collected in a little amount of time. The VGI created in this lab where end users will be able to upload the condition of sidewalks, green areas, and fire hydrants. Users will be able to show whether a sidewalk is in good or poor condition, if a fire hydrant is red or yellow, or if a green space is lush or in need of fixing. Users will be able to upload the location, comments, and photos for each feature. This will be accomplished by meeting the two main goals of this lab:
  1. Create the feature classes for the VGI app and publish them to the server.
  2. Construct the VGI app in JavaScript API and make it mobile responsive.

Methods

1. Create the Feature Classes for the VGI app and Publish Them to the Server

This was done by completing the following described tasks in bold.

Create Domains and Subtypes for Enterprise Geodatabase Features
  The domains and subtypes were created by first connecting to the kroeniao enterprise geodatabase in an ArcMap document. Then, the domains and subtypes were altered in the properties of the geodatabase for the fire hydrant, sidewalk, and green space soon to be feature classes.

Design a Feature Template for the VGI
  This was done by first adding the light gray canvas basemap into the data frame. Then, three features classes were created within the kroeniao enterprise geodatabase. One for fire hydrants, one for sidewalks, and one for green spaces. When creating the feature classes, the appropriate domains were assigned to each. This is also where the attributes for the features were set up as well.

Create and Add Feature Attachments and Define Symbology
  Next, the ability for attachments such as photos, videos, and other documents to be attached as an attribute were enabled, and the symbology for each subtype was set. Then, using the editor toolbar, features were created for red fire hydrants, a sidwalk in good condition, a yellow fire hydrant, a lush green space area, and a green space area in need of repair. For each feature created a comment and photo attachment were assigned. 

Publish the ArcMap Document
First, the basemap was removed from the data frame and the ArcMap document was saved. Then, a server connection was created to the gis14.uwec.edu (publisher) server through the ArcCatalog toolbar. The map was then published as a service with Feature Access being enabled. This allows for users to edit the feature classes.

2. Construct the VGI App in JavaScript API and make it Mobile Responsive

  Using Notepadd ++, an html, css, and js file were used to code the mobile responsive VGI interface. First, the html was created, this can be seen below in figure 7.0. In the code, several other sheets of code are referenced such as the the imported theme, and the imported JavaScript and css styling sheets. The HTML document is used to create several <div> tags for things such as the template picker, the map, and the template picker button.
Fig 7.0: HTML for VGI Application
  Figures 7.1 and 7.2 display the css code for the VGI interface. This is where all of the <div> tags in the html are formatted so that they will look nice on both a desktop and mobile platform. The picture used for the template picker button (the id #ui-feature-templates-button) was assigned by using a very long html code. Other things styled here include the template picker, the map, the body of the html, the pop-up window, the instructions for how to use the application, and the title of the application. 
Fig 7.2: Part 2 of the css file

Fig 7.1: Part 1 of the css file


  Next, the JavaScript written for the VGI application is shown below in figures 7.3, 7.4 and 7.5. In figure 7.3, the necessary modules are imported, the definition parameter function is set up, snapping is enabled, the geometry service is imported from ArcGIS online, and a basemap is imported to display the feature classes on.
Fig 7.3: Part 1 of JavaScript file for VGI
  Figure 7.4 adds the feature classes to the map from the universities live server. For the features, a pop-up window is created so that users can view the comments and photos and other attachments about the features which users have added. Then, a new function is coded to allow for the editing of features. Lastly, snapping is enabled to help prevent topology errors.
Fig 7.4: Part 2 of JavaScript file for VGI
  This third section of JavaScript shown below in figure 7.5 is coded in a separate sheet. This code uses a function to allow the template picker to toggle to make the VGI app more mobile friendly. This is done by changing the placement of the template picker and the location of the zoom slider when the toggle button is clicked or touched. This allows users to be able to use their whole screen to view the app.
Fig 7.5: Function to Enable Toggling of the Template Picker
  Lastly, the app was put to the test, and data was collected in the field.

Results

  The application for this VGI can be accessed here: Eau Claire Miscellaneous VGI App. To demonstrate how the the application works, figure 7.6 demos how to add a red fire hydrant. Although the video is shown using a PC, a very similar process is done to add features on a mobile device. The application allows users to add three different types of features (fire hydrants, sidewalks, and green spaces) each having two subtypes. The application is very easy to use and is made so people without much GIS knowledge can use it.
Fig 7.6: Short Demo on How to Use the VGI App


  Figures 7.7 and 7.8 show screenshots of what the application looks like on a mobile device. Figure 7.7 shows what the app looks like when the template picker is toggled off, and figure 7.8 shows what the app looks like when the template picker is toggle on. The template picker is toggled on and off by clicking the button in the upper right.
Fig 7.8: VGI App on Mobile Device With Template Picker On


Fig 7.7: VGI App on Mobile Device With Template Picker Off


Sources

ArcGIS.com 2016, (n.d) Geometry Services retrieved from
   https://tasks.arcgisonline.com/ArcGIS/rest/services/Geometry/GeometryServer
Red fire hydrant [Digital image]. (n.d). Retrived from
    https://www.dreamstime.com
Js.ArcGIS.com 2016, (n.d) Claro Themes retrieved from
    https://js.arcgis.com/3.22/dijit/themes/claro/claro.css

Wednesday, November 15, 2017

Lab 6: ArcGIS API for JavaScript 2: Mobile Responsive Apps

Goals and Background

  The goal of this lab is to create two different types of mobile responsive query apps. The first type will based on users entering search information where the results will be shown in a pop-up window and the second type of query app will return a graphic with aided text to display the queried data by the developer, but specified by the user. There will be two apps of the search type. The first will enable users to search addresses, congressional districts, and senators. The second will allow users to search addresses, congressional districts, and universities. There will be one query app developed which will use Wisconsin census data queried by the developer where the user will hover his or her curser over a county and a graphic with explanatory text will provide population information compared to the most populous county in Wisconsin.


Methods

 Part 1: Creating a Search App
  Below in figure 6.0 is the HTML used for creating the first search app. This html is used to make the map mobile responsive by including the <meta> tags for Chrome for Android and Viewport for iOS devices. This is also where the esri claro css file is referenced. Some basic css is included in this HTML because there isn't very much to customize. The css is used to style the map and the search box.
Fig 6.0: HTML for the Search Query
  Next, the JavaScript file for the search app is displayed below in figures 6.1 and 6.2. This is where the modules are imported and the function definition parameters are accessed. This is also where the search bar style/interface is set, where the feature classes used are imported, and where the formatting for the search parameters and pop-up are set. The app is coded so that users can choose to search for attribute and location information about addresses, congressional districts, or senators, but not all at once.
Fig 6.1: JavaScript for the Search App

Fig 6.2: JavaScript for the Search App
  Next, the search app developed above was modified so that users could search for universities instead of senators. This code is not displayed in this post because it is very similar to the code shown in figures 6.0, 6.1, and 6.2.

 Part 2: Creating the Query App
  Figure 6.3 shows the HTML used to code the query app. This HTML also utilizes the <meta> tags to make the map be mobile responsive. A couple of css files are externally referenced for the styling of the webpage here as well. The map to be displayed in the page is located in the map div within the body of the webpage.
Fig 6.3: HTML for Query App.
  Figure 6.4 shows the css used in the query app. Selectors are used to identify the styling of objects. The css is used to style the map, area where the "county info" is located, and where the name of the highlighted county and population of that county is located.
Fig 6.4: Css used in Query App
  Figures 6.5, 6.6, and 6.7 below display the JavaScript used in the query app. This is where the modules are imported, the map is initialized, the query filter is set up, the gauge is created, and the functionality of the gauge is coded.

6.5: JavaScript for Query App

6.6: JavaScript for Query App

6.7: JavaScript for Query App


Results

  Figure 6.8 is a screen capture of the first search app created in part 1. The search app is also linked here: Congressional Search App. Note, that the all of the links for the web apps in this results section will only work if one is connected to the University of Eau Claire's internet. In the figure, Senator Rand Paul is searched for in the app by selecting the "Senator" option in the search bar and typing in his name as "Paul, Rand". The name must be typed in this way because in this is the way the name is formatted in the feature class attribute table. This then brings the user to a point which when clicked on will display the attribute information shown in the figure.
Fig 6.8: Search App 1
Fig 6.8: Congressional Search App

  Figures 6.9 and 6.10 are results of the second search app developed in part 1. The web app is linked here: University Search App. In figure 6.9, one can see the three different possible searches which one can perform: the Esri Worl Geocoder, Congressional Districts, or Universities. The figure shows that the universities search was used to find the University of Minnesota. Then, when the point for the university is clicked on, the pop-up window is displayed as shown below detailing the attribute information about the University of Minnesota. The results can also be seen in the short video in figure 6.10.

Fig: 6.9: University Search App

Figure 6.10: University App Video

  Lastly, figures 6.11 and 6.12 shows the results of the Wisconsin query app which is also link here: Wisconsin Query App. In this application, users are able to hold his or her curser over different counties in Wisconsin to see how that county's population compares to the population of Milwaukee county, the most populous county in Wisconsin. Along with the query information is a interactive gauge which graphically displays the results. Figure 6.12 is a short video which shows how this app works while figure 6.12 is a screenshot of the application.

                                                                                                   Fig 6.11: Wisconsin Query Video 
Fig 6.10: Wisconsin Query App
Fig 6.12: Wisconsin Query App

Sources

ArcGIS.com. 2016, (n.d) from http://services.arcgis.com/V6ZHFr6zdgNZuVG0/ArcGIS/rest/services
Esri JavaScript Compact 2016. (n.d.). from http://js.arcgis.com/3.22compact/init.js 
Wilson, C. (2017). Lab 6 ArcGIS API for JavaScript 2: Mobile Responsive Apps
       https://drive.google.com/file/d/1LD4T5m-PvYufuu2Fs9hsiGfvk930UBYw/view?usp=sharing

Wednesday, November 8, 2017

Lab 5: ArcGIS API for JavaScript 1

Goals and Background

  The goal of this lab is to use API for JavaScript to customize one web app and to create two web apps to embed in a webpage. The use of ArcGIS JavaScript API allows for the creation of widgets, themes, and analytics from scratch, and allow for the customization of existing web apps. The use of ArcGIS JavaScript in this lab will be used to modify window extents, create scalebars, import data, import basemaps, and to create a routing solver application. This lab is broken into three parts.

Methods

Part 1: Create a Basic Web GIS Mapping App

  
  This part consists of creating and displaying a basemap in a webpage without any data on it through referencing the dojo library. The styling for the map was imported through the use of claro through arcgis.com, but the styling for the web extent is set.

  Step1: Write the HTML Code:

  Figure 5.0 shown below details the HTML portion of the code. The html code is what is used to display the final web app in a web page. In this document, the formatting of the webpage is coded, and the css file for the styling of the map and JavaScript file where the map is set up is referenced. There are a few lines of css in the HTML in here to display the extent of the imported map. These are inserted directly into the HTML because there is so few lines of it.

Fig 5.0: HTML File -Displaying the Basemap
  Step 2: Write the JavaScript File to Import and Format the Web GIS Basemap

   Figure 5.1 displays the JavaScript for the basemap web app . In this script the require command is used to import the necessary modules from the Dojo library, and a function is used to set the extent, type, and zoom of the map.
Fig 5.1: JavaScript for Basemap

Part 2: Build a Web GIS App with Operational Layer Functionality

  Section 1: Developing JavaScript Methods to Display Tree Species and Attributes

  In this section, a web GIS app was created to display the location of trees in the San Francisco area. A pop up will be configured so that when a tree is clicked on, it displays the address of the tree and the common name of it.

Step 1: Write the HTML Code

  Figure 5.2 shown below displays the HTML code used to accomplish the objective above. This code is what formats the map within the web page. The code calls in the JavaScript file and the css file where the map is configured and styled. The css for this web app map is stored  In the first <script> tag, the script is prompted to run after the parser has already loaded. This helps the map in the webpage to not lag. Also in the HTML is the use of the view import <meta> tag which helps to make the webpage mobile friendly.
Figure 5.2: HTML for Tree Map
 Step 2: Write the JavaScript for the Tree Map

  Figures 5.3 and 5.4 show the JavaScript used to construct the tree map. In the code, several modules are imported from the Dojo library, multiple variables are defined to create or import features on the map such as pop-up windows, feature layers, and map extent, and two functions are used: one is to make the imported Dojo modules accessible, and the other is to display only the address and common name information for the trees in the pop-up window.
Fig 5.3: JavaScript Code for Tree Map


Fig 5.4: JavaScript Code for Tree Map


Section 2: Feature Service Creation & Development of a Web App for Eau Claire Schools

  In this section, the previous code used in figures 5.2, 5.3, and 5.4 are copied and then modified to produce a map which shows schools in Eau Claire with their addres, name, and elevation in the pop-up window. Instead of referencing the feature class from ArcGIS Online, the feature class will be referenced from the department server. Before this though, the data must be published and formatted first. Also, a scalebar will be added to the map, and the extent will be modified.

  Step 1: Publish the School Data to The Server

  First, the data had to be prepared to be published to the department server. The address data for the schools was provided in an Excel sheet, and the school location data was provided in a shapefile. The Excel sheet had to be joined to the school shapefile using ObjectID as the common key. Then, this joined table with the shapefile was exported as a new feature class into a geodatabase. Next, the feature class was published to the server the using the same process described in part 2 of lab 2.

  Step 2: Modify the Existing Code to Display the School Address Map

  The HTML for this web app is shown below in figure 5.5. Only one line of code had to be changed in the HTML. This was the line in which the JavaScript script is referenced.

Fig 5.5: HTML Code for School Address Web App Map
  Figure 5.6 shows the JavaScript used for the school map. A scale bar will be added to the map, the pop up window will be modified, and the lodaded extent will be chaged. These changes can bee seen below. In the script, the esri/dijit/Scalebar module was added and then used to create a scalebar in lines 35-38, the map zoom and loaded extent was changed in lines 29 and 30, and the pop-up was reconfigured in lines 42-44, and 55. Also, because the map no longer needs to work with graphics from a hyperlink, the getTextContent (graphic) function was deleted. 

Fig 5.6: JavaScript for Eau Claire Schools Web App Map


Part 3: Developing a Simple Routing Application

  This part of the lab consists of creating a routing application where a route can be created and calculated when the user clicks on the maps and adds two or more stops.

  Step 1: Code the HTML
  
  Figure 5.7 dislays the HTML used to code the routing application. This is where the css and JavaScript files are referenced and where the <div> for the map is created. Also, a few webpage elements such as background color and introductory text were added to make the webpage look more appealing.
Fig 5.7: HTML for the Routing Application
  Step 2: Code the JavaScript

   Below, in figures 5.8 and 5.9 is the JavaScript coded for the routing application. As usual, the necessary modules are importedd from the Dojo library and are then made usable in the function definition parameter. Then, a series of variables and functions are used to develop the routing web app.
Fig 5.8: JavaScript for the Routing Application
Fig 5.9: JavaScript for the Routing Application

Results

  The results of parts 1, 2, and 3 are four different web applictions saved on the university's server.  Because of this, these applications can only be viewed if one has access to all of the files which can be done through connecting to the Univerity of Wisconsin Eau Claire's internet. Because all off the code for these web applications are hosted on the university's server, screenshots of the applications are provided. Also, links to the applications are provided for readers using the university's internet.
  Figure 5.10 shows the web application created in part 1. The link to this application is found here: Basic Basemap Application. This application allows the end user to view the streets basemap. The user can zoom in and out at different scales and can pan around on the map.

Fig 5.10: Basic Basemap Application
  The San Fransisco tree mapping application is the results of the code displayed in the methods in part 2, section 1 and is shown below in figure 5.11. It is also linked here: San Francisco Trees Map. In this application users can zoom in and out and pan around like before and they can see the locations of trees in the San Francisco area. They can even click on a tree to view the address of it and its common name. Figure 5.12 is what the pop-up window looks like.


Fig 5.11: San Fransisco Trees Web App

Fig 5.12: Configured Pop-up for Trees

  Next, shown below in figure 5.13 is the Eau Claire Schools web app, and is a result of the code in part 2, section 2. It is also linked here: Eau Claire Schools Map. This application allows users to zoom in and out, pan around, use the scalebar as a reference for scale, see the locations of schools in the Eau Claire area, and find out more information about the schools by clicking on them. Figure 5.14 shows was the pop-up looks like when the user clicks on a school.

Fig 5.13: Eau Claire Schools Web App Map
Fig 5.14: Configured Pop-up for Eau Claire Schools
  Lastly, figure 5.15 shows the resulting routing application generated by the code in part 3. The application is link here: Routing Application. In this application, users can click on the map to create solved routes, they can zoom in and out, and pan the map as well. If a user clicks on an area which cannot be routed, no route will be calculated to that point, and the next point which the user clicks will  be a part of the new calculated route.

Fig 5.15: Routing Application
Sources

ArcGIS for Developers. (2017). Retrived November 07, 2017, from https://developers.arcgis.com/
Dojo Toolkit Reference Guild. (n.d.). Retrieved November 07, 2017, from http://dojotoolkit.org/reference-guide
Geog 455 (2013, November). [EC School Addresses]. Unpublished raw data.
Mueser, M (2012, October 1). U.S. Geographic Names Information System (GNIS) Shapefiles Based on USGS GNIS 
      Data. Retrieved November 07, 2017, from http://www.mapcruzin.com/geographic-names-shapefiles/#School
Wilson, C. (2017). Lab 5 ArcGIS API for JavaScript 1
       https://drive.google.com/file/d/173Et59MebzhjihBHwQFfg6AVuFjlSpHe/view?usp=sharing


Wednesday, October 25, 2017

Lab 4: Basic HTML, CSS, and JavaScript

Goals and Background

  This lab will demonstrate how to use Hypertext Markup Language (HTML), cascading style sheets (CSS), and JavaScript to code a custom webpage. All three languages will be used concurrently to create two separate web pages. Both webpages will be similar. The first webpage will be created by following a detailed list of instructions explaining the code. This will be explained in more depth in part one below. The second webpage will be created by using the code from first webpage as an example to design a hypothetical GIS company's website devised by the author. This webpage will include the following 8 features:
                                     1. The name of the company 
                                     2. The company logo
                                     3. Links to resources that will be useful to the company           
                                     4. Links to the Historic Earthquakes and Hurricanes web app created in lab 3
                                     5. Two non-secure links to web apps from the Esri JavaScript website
                                     6. An ordered list of six services which the proposed company will provide
                                     7. A form which will allow users of the webpage to search the proposed companies 
                                     8. Three pictures which are important for the company

Methods

Part 1: Creating a Webpage with HTML, CSS, and JavaScript

Step 1: Create and Design the webpage using HTML
  First, the title and header of the webpage where created. The title of a webpage is what is shown in the reserve bar at the top of a window. Example titles are shown below in figure 4.0. The title of web page is important because it is what the end-user will use to search for the webpage in a search engine such as Google or Bing. The name of the title given to this webpage is My Test Page.
Fig 4.0: Example of Webpage titles
  No text displayed on the webpage is located within the header tag, this is because a custom header will be created instead using the div tag within the body tag of the webpage. The div tag is used to create a section within the HTML page which can be styled individually with CSS based on its assigned ID. The code for the header and title can be seen below in figure 4.1. Also in the code is a reference to the separate CSS sheet which will be explained in step 2. The div used for the header is given an ID of "header" so that it can be styled uniquely in the CSS sheet. Similarly, another div given the ID "wrapper" was created so that it can be styled separately as well. The header includes the University's logo by use of the image tag, and three different heading styles: <h1>,<h2>, and <h3>. Each style has a descending font size with <h1> being the largest. The text associated with the headings provide a little background information about the author.
Fig 4.1: Coding the Header and Title in HTML

  Next, a new div was created assigned with an ID of "main". Then, an entry form was designed along with some introductory text for it. This form is an input form which will allows the end-user to enter in comments about the webpage. The code for this can be seen below in figure 4.2. There are many attributes located in this block of code. Attributes provide information about an html tag. They also help to format the tag. For example, the type attribute can be given many different values including Submit, Text, and, Radio. Each way will change the way end-users enter data into the form. The form type and value for this webpage is assigned to Submit.
Fig 4.2: Main div, and Simple Form HTML Code Block
  The next block of code for the HTML index file is shown below in figure 4.3. The code creates a list of the hobbies of the author. To make the list, the unordered list tag <ul> is used with each hobby listed within a list tag <li>. Line 30 of the code includes a non breaking space paragraph.
Figure 4.3: Unordered List of Hobbies
  Figure 4.4 shows the last block of code in the HTML file. One can enlarge the image by clicking on the figure. The first part of this code provides some intro text and a link to the universities geography and anthropology homepage. Then, a results box is coded which will be coded and styled more in the JavaScript and CSS files. Next, a picture of the Historic Earthquakes and Hurricanes lab is inserted into the webpage. A link to the web app is also given. Then, an updated line and code reference line is added to the file. Lastly, the JavaScript file is referenced using the script tag for the results box.
Fig 4.4: Results Box, Earthquakes and Hurricanes App Insert, and Code Reference


Step 2: Add CSS to the webpage
 Figures 4.5 and 4.6 shows how CSS was used to style the webpage. The CSS document is referenced in the HTML a couple different ways. The main way to reference it is to create an ID within a div. Also, a whole tag can be referenced such as the body tag displayed in line 3. To connect the CSS with the ID in the HTML document the # symbol is used. The properties assigned to the divs are mostly self explanatory, but the values are not. Color hex codes were used to code color. This makes each color easily identifiable. For the size of properties, either a px value or an em value was used. Px values determines the size in terms of pixels while em values are relative compared to the size of text or spacing around them. Without the use of CSS, the webpage will look very bland as it will only be in black and white.

Fig 4.6: CSS for HTML

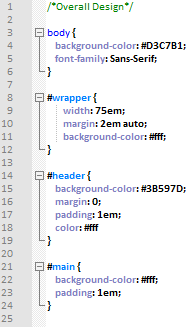
Fig 4.5: CSS for HTML


Step 3: Add JavaScript to the webpage
  To make this first webpage fully functional, lastly, the JavaScript was coded. This can be seen below in figure 4.7. In the code is a simple function which is used to display text in the results box in the webpage. There are three variables created for it. The first variable is used to to find the the location of the results box within the HTML file, the second variable creates a new paragraph for the expressed results, and the third variable creates a text node to put inside the newly created paragraph. Lastly, the variables are assembled together to aggregate all three of the variables tasks and the text to be displayed in the results box are displayed in line 18.
Fig 4.7: JavaScript Used for the Results Box

Part 2: Creating a Webpage for Sunny Side GIS

The hypothetical company created for this lab is Sunny Side GIS. This companies goal is to educate people about the uses and applications of GIS. 


Step 1: Design the Webpage using HTML
  Figure 4.8 shows the first half of the HTML code for the Sunny Side GIS's webpage. The outline of this webpage is very similar to that of the web page created in part 1 of this lab. The code below creates a result box to display some text, a title for the webpage, a customized header with the name of the company, their mission statement, and their logo, and an unordered list which includes links for which people trying to learn and apply GIS will find useful.
Fig 4.8: Header, Title, and Unordered list of Resources
Fig 4.8: Header, Title, and an Unordered list of Resources

 The second half of the HTML code is displayed below in figure 4.9. This code starts off by providing a few links for the end user for two of Esri's Web GIS applications and to the Historic Earthquakes and Hurricanes web app created in lab 3. After that, an ordered list of services of which Sunny Side GIS provides is coded. These are services which a customer can use to further their GIS skills. Next, a search form is inserted so that users will be able to enter text in search bar to look for content within the webpage. Lastly, the JavaScript file is attached to the document so it can be referenced for the results box.
Fig 4.9: Coding Useful Links, Services, and a Search Form in to the Webpage
Fig 4.9: Coding Useful Links, Services, and a Search Form in to the Webpage 

Step 2: Add CSS to the webpage
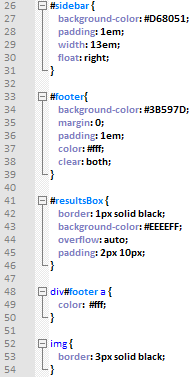
Figures 4.10 and 4.11 display the CSS used to style the webpage. Both class selectors and ID selectors are used. Similar to part 1, color hex codes were used to code colors and em and px were used to define the size for text and spacing.

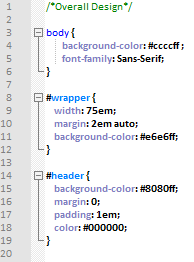
Fig 4.10: CSS Used for Styling
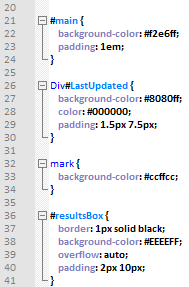
Fig 4.11: CSS Used for Styling

Step 3: Add JavaScript to the webpage
  Figure 4.12 displays the JavaScript used to format the results box. This function is identical to the one used in part 1 displayed in figure 4.7 with the exception of the returned results. Therefore the function as identical flow as in part 1.
Fig 4.12: JavaScript Used for the Results Box


Results

  The results of the methods sections is two separate web pages saved to the university's server. Therefore, these pages can only be viewed if one has access to all of the files in the server. Because these webpages are inaccessible in a browser from this report a screenshot of each webpage is provided.
  Figure 4.14 shows the results of part one. All of the text with the exception of the results box is a result of the HTML code. The html code also breaks up the web page into many different sections by using the div tag. This is shown below through use of a wrapper around the body of the webpage, a header which displays the UWEC logo and some introductory information about the webpage, a main area of the document where most of the information is displayed, and a footer which includes the references for the code. The overall layout is fairly simple. The CSS is used to add all of the colors and formatting to the document while the JavaScript is used to place text inside of the result box.
Fig 4.14: My First Web Page Development Exercise
  The Sunny Side GIS company's webpage is displayed below in figure 4.14. This webpage has many similarities to the one in figure 4.14 including the wrapper, header, main body, and footer layout. This webpage displays Sunny Side GIS's mission statement, logo, helpful links for people wanting to learn and apply GIS, links to Esri's two non-secure mapping applications, a link to the historic earthquakes and hurricanes application created in lab 3, and a search bar. With these features, the six goals for this webpage addressed in the introduction have been met.

Fig 4.15: Sunny Side GIS Webpage


Sources


Sylvia, R. (2015). Girl Develop it Github. Retrieved October 2017, from https://github.com/girldevelopit
UWEC logo [University of Wisconsin's Eau Claire Logo]. (n.d.) Retrieved October 25, 2017, from uwec.edu
W3Schools Online Web Tutorials. (n.d.). Retrived October 25, 2017, from https://www.w3schools.com/default.asp
Wilson, C. (2017). Lab 4 HTML, CSS, and     JavaScript https://drive.google.com/file/d/0B1RJN5un8yU8ZUwtWnpZRksxTmM/view?usp=sharing