Goals and Background
This lab entails using the Web AppBuilder for ArcGIS to build an app in the Integrated Edition and the Developers Edition. The Integrated Edition is available through ArcGIS Online. The Developers Edition is accessed on a local computer through a program called node.js. The developed web app will be based on the earthquake and hurricanes web map created in lab 2. The web app will enable the end user to perform the following geospatial analysis:1. Examine pop-up windows for earthquakes and hurricanes
2. See set extent of the entire United States when launched
3. Use designed bookmarks
4. Chart earthquakes and their attributes
5. Query features based on attributes
6. Construct and analyze elevation profiles
After creating the web app, it will be deployed to web gis geography server so that it will be accessible though a browser.
Methods
Part 1: Build The Web App Using the Integrated EditionCreating the web app using the integrated edition allows the web app to be created easily and quickly. Because there is no coding involved, The Web AppBuilder is a good tool for GIS users to understand the interface and design (theme, style, layout, widgits, etc) of web apps at a basic level . The Web AppBuilder is a good segue between using object oriented interface and a coding interface because it lays down the foundational components of creating a web app.
To create the web app, first the Web AppBuilder feature was accessed in ArcGIS Online. Next, an appropriate theme, style, and layout were chosen. Then, the basemap gallery, measurement, and bookmark widgets were added. Two bookmarks were configured in the bookmark widget: Eastern States and Western States. These two bookmarks set the extent to either the western United States or the eastern United States. After that, a title, logo, and link to the geography and anthropology department's home page was inserted under the attribute tab. Then, the draw, query, and chart widgets were added and configured.
For the chart widget, two tasks were created: Magnitudes and Depths(km). For the magnitudes task, the value field was set to the magnitude of the earthquake and the category label set to the earthquakes location. In the Depths(km) task, the earthquake depth was set as the value field and the earthquake location was set as the category label.
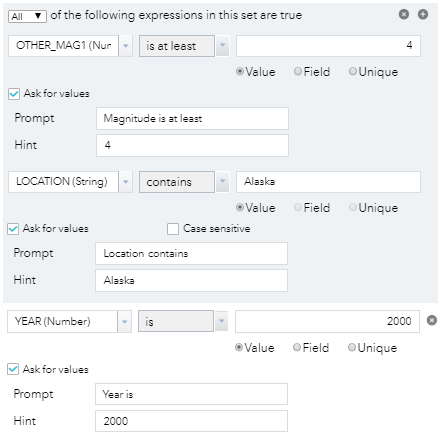
The last thing to add to the app was the query widget which was configured by using both the Add an expression and Add a set features. As displayed in figure 3.0 below, the query was set up so that users can query earthquakes by magnitude, location, and year. The constraints are that the magnitude must be at least 4, the location must be in Alaska, and they year must be 2000.
 |
| Fig 3.0: Query Set Up |
Part 2: Using Web AppBuilder for ArcGIS in the Developer Edition
The Developer Edition is much more powerful than the Integrated Edition. It allows for users to customize and extend the capabilities available using the Integrated Edition. This will be demonstrated by adding a custom elevation profile widget to the web app. The Developer edition can only be run on a local computer.
The Developer Edition was started up by navigating to the .bat startup file in the file explorer for the Web AppBuiler for ArcGIS. Then, the local host URL was used to register the computer with the Web AppBuilder Developer Edition. After registration, an attempt was made to import the app created above in the Integrated Edition. However, there was an issue with the theme. As seen below in figure 3.1, the theme used in the Integrated Edition was in a newer version than what could be supported by the Developer Edition. This issue was attempted to be resolved by changing the theme in the Integrated Edition. Unfortunately, this didn't work and no solution to fix the error could be found, so the app had to be recreated in its entirety in the Developer Edition. The app was recreated with the same theme, widgets, style, and layout the same way it was in the Integrated Edition.
 |
| Fig 3.1: Error when attempting to import the web app into the Integrated Edition |
A couple more widgets were added to the web app. First, the elevation profile widget was added by transferring the folder with the coding for the elevation profile widget to the widgets folder in the Developers Edition. Then, the elevation profile widget was added to the web app. This widget didn't need to be configured at all after this as the defaults allow for sufficient analysis. Lastly, the share widget was added to the web app just like the chart, draw, and query widgets were in part one. This was added so that the web app could be more easily shared as it provides a sharing link, and html coding to embed the app in a website.
After all of this, the web app is complete and ready for publishing. The web app was saved as an HTML file within the universities server in order to make the app available to anyone using the university's internet. This was done by using the download button seen below in figure 3.2. Clicking this downloads the zip folder for files for the web app. This folder was then saved to the geography web gis server drive making it easier to access. This download button is only accessible on the local host browser web page for the ArcGIS web AppBuilder application and for the creator of the web app.
 |
| Fig 3.2: Downloading the Zip Folder |
Results
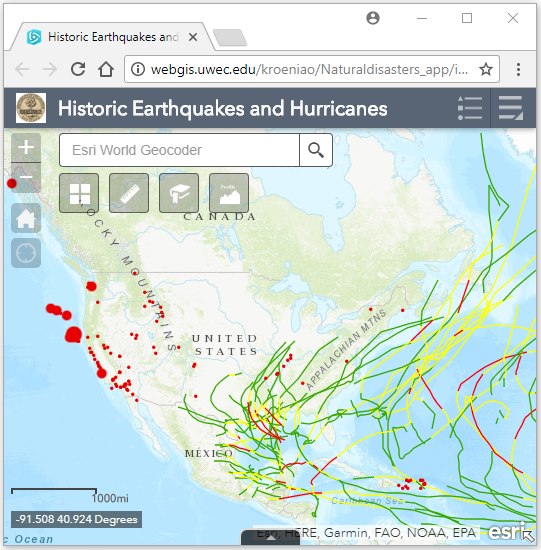
Below in figure 3.3 is a screenshot of the Historic Earthquakes and Hurricanes web app just created. It has many different capabilities as described in the methods section of this report. The functional web app can be found by clicking on this link: Historic Earthquakes and Hurricanes.To help one navigate the web app, one can locate the name of the widgets by holding his or her cursor over them. For reference the widgets are located underneath the Esri World Geocoder search bar and in the upper right corner of the window. In the web app, one is able to analyze earthquakes and hurricanes through using the pop-up window by clicking on them, charting magnitude and depth of individual earthquakes with the chart widget, querying earthquakes with the query widget, using the measure widget to measure distances, and by using the elevation profile widget to help locate where potential disasters such as flooding or landslides could occur because of future earthquakes or hurricanes.
 |
| Fig 3.3: Screenshot of web app |
Sources
ArcGIS Online, Esri, https://www.arcgis.com/home/index.html
Earthquakes data layer, Fu, Pinde, USGS National Atlas, 2015
Hurricanes data layer, Fu, Pinde, NOAA National Climatic Data Center, 2015
Web AppBuilder for ArcGIS, Wilson, Cyril, https://drive.google.com/file/d/0B1RJN5un8yU8
No comments:
Post a Comment