Goals and Background
The goal of this lab is to create two different types of mobile responsive query apps. The first type will based on users entering search information where the results will be shown in a pop-up window and the second type of query app will return a graphic with aided text to display the queried data by the developer, but specified by the user. There will be two apps of the search type. The first will enable users to search addresses, congressional districts, and senators. The second will allow users to search addresses, congressional districts, and universities. There will be one query app developed which will use Wisconsin census data queried by the developer where the user will hover his or her curser over a county and a graphic with explanatory text will provide population information compared to the most populous county in Wisconsin.
Methods
Part 1: Creating a Search App
Below in figure 6.0 is the HTML used for creating the first search app. This html is used to make the map mobile responsive by including the <meta> tags for Chrome for Android and Viewport for iOS devices. This is also where the esri claro css file is referenced. Some basic css is included in this HTML because there isn't very much to customize. The css is used to style the map and the search box.
 |
| Fig 6.0: HTML for the Search Query |
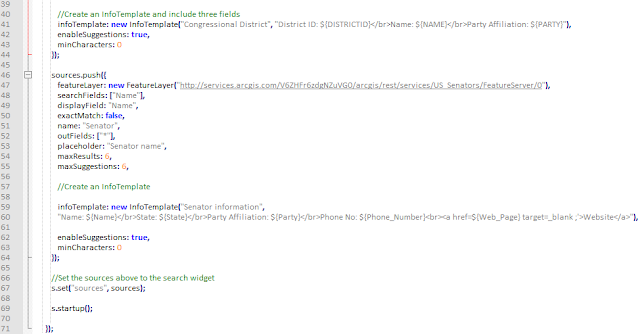
Next, the JavaScript file for the search app is displayed below in figures 6.1 and 6.2. This is where the modules are imported and the function definition parameters are accessed. This is also where the search bar style/interface is set, where the feature classes used are imported, and where the formatting for the search parameters and pop-up are set. The app is coded so that users can choose to search for attribute and location information about addresses, congressional districts, or senators, but not all at once.
 |
| Fig 6.1: JavaScript for the Search App |
 |
| Fig 6.2: JavaScript for the Search App |
Next, the search app developed above was modified so that users could search for universities instead of senators. This code is not displayed in this post because it is very similar to the code shown in figures 6.0, 6.1, and 6.2.
Part 2: Creating the Query App
Figure 6.3 shows the HTML used to code the query app. This HTML also utilizes the <meta> tags to make the map be mobile responsive. A couple of css files are externally referenced for the styling of the webpage here as well. The map to be displayed in the page is located in the map div within the body of the webpage.
 |
| Fig 6.3: HTML for Query App. |
Figure 6.4 shows the css used in the query app. Selectors are used to identify the styling of objects. The css is used to style the map, area where the "county info" is located, and where the name of the highlighted county and population of that county is located.
 |
| Fig 6.4: Css used in Query App |
Figures 6.5, 6.6, and 6.7 below display the JavaScript used in the query app. This is where the modules are imported, the map is initialized, the query filter is set up, the gauge is created, and the functionality of the gauge is coded.
 |
| 6.5: JavaScript for Query App |
 |
| 6.6: JavaScript for Query App |
 |
| 6.7: JavaScript for Query App |
Figure 6.8 is a screen capture of the first search app created in part 1. The search app is also linked here:
Congressional Search App. Note, that the all of the links for the web apps in this results section will only work if one is connected to the University of Eau Claire's internet. In the figure, Senator Rand Paul is searched for in the app by selecting the "Senator" option in the search bar and typing in his name as "Paul, Rand". The name must be typed in this way because in this is the way the name is formatted in the feature class attribute table. This then brings the user to a point which when clicked on will display the attribute information shown in the figure.
 |
| Fig 6.8: Congressional Search App |
Figures 6.9 and 6.10 are results of the second search app developed in part 1. The web app is linked here:
University Search App. In figure 6.9, one can see the three different possible searches which one can perform: the
Esri Worl Geocoder, Congressional Districts, or
Universities. The figure shows that the universities search was used to find the University of Minnesota. Then, when the point for the university is clicked on, the pop-up window is displayed as shown below detailing the attribute information about the University of Minnesota. The results can also be seen in the short video in figure 6.10.
 |
Fig: 6.9: University Search App
Figure 6.10: University App Video
|
Lastly, figures 6.11 and 6.12 shows the results of the Wisconsin query app which is also link here:
Wisconsin Query App. In this application, users are able to hold his or her curser over different counties in Wisconsin to see how that county's population compares to the population of Milwaukee county, the most populous county in Wisconsin. Along with the query information is a interactive gauge which graphically displays the results. Figure 6.12 is a short video which shows how this app works while figure 6.12 is a screenshot of the application.
Fig 6.11: Wisconsin Query Video


No comments:
Post a Comment